Walk into almost any garment factory on a Monday morning and you'll see the same thing: machines humming, operators bent over their work, supervisors pacing the floor with a clipboard or a tablet. On paper, everything looks efficient. Machines are running. People are working. Fabric is moving. But ask the production manager what the line efficiency was last week, and there's a good chance the number will disappoint you — 65%, maybe 70% if it's a good week.
Here's the uncomfortable truth learned after two decades on factory floors from Dhaka to Phnom Penh to Ho Chi Minh City: busy doesn't mean balanced. Plenty of "efficient" factories have every operator working flat out, needles flying, and the line is still losing 20–30% of its potential output. Not because people aren't trying. Because the work isn't distributed correctly across the line.
That's the paradox that keeps merchandisers up at night and eats into margins nobody notices until the P&L comes out. A line can look busy and still be bleeding money. One operator is drowning in a 45-second operation while the person next to her breezes through a 20-second task and then waits. Multiply that gap across 30 or 40 operators, eight hours a day, six days a week, and you're looking at thousands of lost minutes — minutes that translate directly into missed shipment dates, overtime costs, and unhappy buyers.
This is where garment line balancing comes in. It isn't a buzzword. It's the single most impactful lever an industrial engineer or production manager has to close the gap between installed capacity and actual output. Done well, it can lift line efficiency from the 60s into the 80s without adding a single machine or hiring a single new operator. Done poorly — or not at all — it quietly costs factories millions of dollars a year in lost productivity.
This guide covers the theory, the formulas, the software, and real factory examples: everything from the basic vocabulary (SMV, takt time, pitch time) through worked case studies you can actually apply on the floor tomorrow morning.
What Is Garment Line Balancing?
Garment line balancing is the process of distributing the total work content of a garment — every stitch, every fold, every trim — evenly across all the operators and machines on a sewing line, so that no single workstation becomes a bottleneck and no operator sits idle waiting for work.
Think of a sewing line as a chain of workstations. A chain is only as strong as its weakest link. If one operation takes twice as long as the others, the entire line's output speed drops to match that slowest operation, no matter how fast everyone else works. Line balancing is the discipline of finding that weak link before production starts — and either strengthening it, splitting it, or redistributing the work so the whole chain moves at roughly the same pace.
A Simple Way to Understand It
Imagine four friends packing boxes on an assembly line. One person places the item in the box (5 seconds), the next adds tissue paper (3 seconds), the third seals the box (8 seconds), and the fourth applies the label (2 seconds). No matter how fast the first, second, and fourth people work, the line can only produce one box every 8 seconds — the time it takes the slowest person. That's the bottleneck. Line balancing means giving the box-sealer some help, maybe splitting the sealing task, so the whole team moves closer to a consistent 4–5 second pace per person.
Real Factory Example: The Collar That Strangled a Line
A woven shirt factory in Bangladesh was producing a basic men's casual shirt with an SMV of 22 minutes, on a line of 32 operators. On paper, capacity looked solid. But the collar attach operation — a single-needle lockstitch task requiring precise matching — was taking 1.4 minutes per piece, while most other operations averaged 0.65 minutes. That one operation was strangling the entire line. Output was stuck at 380 pieces a day against a target of 520.
No machines were added. No one was hired. The fix was splitting collar attach into two sub-operations (collar run-stitch and collar top-stitch) and assigning a second, slightly more skilled operator to help. Within four days, output climbed to 495 pieces, and by week two, the line hit 510 — a 34% improvement using existing resources.
Did you know? The term "line balancing" originated in general assembly-line manufacturing (Henry Ford's automobile plants), long before it was adapted for garment sewing lines in the mid-20th century.
Why Line Balancing Matters
Line balancing isn't just an industrial engineering exercise — it touches nearly every metric a factory cares about.
| Area | Why It Matters |
|---|---|
| Productivity | A balanced line produces more output per hour with the exact same people and machines — there's no faster way to lift productivity without capital investment. |
| Operator Utilization | When work is balanced, operators spend their time sewing, not waiting for bundles. Idle time is invisible waste — it never shows up as a stoppage, but it silently erodes output. |
| Production Efficiency | Poor balancing is one of the top three causes of low efficiency in almost every efficiency audit, alongside absenteeism and machine downtime. |
| WIP Reduction | An unbalanced line creates bottleneck stations where bundles pile up, tying up floor space and hiding quality issues until someone finally opens those bundles. |
| Delivery Performance | Late shipments almost always trace back to a capacity miscalculation somewhere upstream — often a line that was never properly balanced for the style's actual work content. |
| Cost Reduction | Every idle minute is a paid minute with no output. Multiplied across dozens of operators and hundreds of production days, unbalanced lines become one of the most expensive — and most fixable — sources of waste. |
| Quality Improvement | Rushed operators at bottleneck stations cut corners and skip checks; under-loaded, bored operators lose focus too. A balanced line keeps everyone at a sustainable, focused pace. |
| Operator Morale | Nobody likes holding up the whole line, and nobody likes standing around unpaid on pieces they can't produce fast enough. Balanced lines feel fair, and it shows in retention. |
Pro tip: When auditing a low-efficiency line, always check line balance before blaming operator skill or attendance. Roughly 4 out of 10 "efficiency problems" reported by supervisors turn out to be balancing problems in disguise.
Objectives of Garment Line Balancing
- Minimize idle time across all workstations so labor cost per minute produces maximum output.
- Eliminate or reduce bottlenecks that cap the line's overall output speed.
- Match operator capacity to takt time, ensuring each station can keep pace with customer demand.
- Optimize manpower deployment — using the minimum number of operators needed to hit the target, rather than over-resourcing a line.
- Reduce WIP and improve flow, so bundles move smoothly from one operation to the next.
- Improve line efficiency and productivity without additional capital investment.
- Support on-time delivery by ensuring the line's real capacity matches the planned production schedule.
- Enhance quality by preventing rushed work at overloaded stations.
- Create a stable, predictable output rate that planning and merchandising teams can rely on.
- Improve operator satisfaction through fair, evenly distributed workloads.
The Core Concepts and Vocabulary
To balance a line properly you need a handful of core concepts. These aren't optional — they're the vocabulary and math that make balancing possible.
Work Content
The total amount of work — measured in time — required to complete one garment from start to finish. It's the sum of every single operation's SMV.
Work Content = Sum of the SMV of every operation
Cycle Time
Cycle time is the actual time it takes an operator to complete one operation, one time, including handling (picking up, positioning, and disposing of the piece). It's what you measure with a stopwatch or time study on the floor — as distinct from SMV, which is the standardized benchmark cycle time gets compared against.
Takt Time
Takt time is the pace at which you need to produce one unit to meet demand.
Takt Time = Available Working Time ÷ Required Output
If a line has 480 available minutes in a shift and needs to produce 480 pieces, takt time is 1 minute per piece. Every workstation should ideally operate at or below this pace.
Capacity
Capacity is the maximum output a line, machine, or operator can produce in a given time period, based on available time and SMV.
Capacity = Available Minutes ÷ SMV
Basic Time
Before an operation ever gets an SMV, it starts as a basic time. This is the raw time a work-study observer records for an operation, adjusted for how fast or slow that particular operator was working compared to a "normal" pace — the rating.
Basic Time = Observed Time × (Rating ÷ 100
Basic Time = Observed Time × (Rating ÷ 100
For example, if an operator is timed doing sleeve attach in 0.75 minutes, but the observer judges the operator was working at 110% of normal pace, the basic time is:
Basic Time = 0.75 × (110 ÷ 100) = 0.825 minutes
Basic time is the "clean" figure — no allowances built in yet. It's what SMV is calculated from, which is why getting the rating right matters just as much as getting the stopwatch reading right. Rate an operator too generously and every SMV built on that observation will be too tight for the rest of the line to hit.
SMV — Standard Minute Value
SMV is the time, expressed in minutes, that it should take a competent, trained operator to perform one operation at a defined pace, with allowances built in for rest, personal needs, and minor unavoidable delays. It's derived through time study (stopwatch method) or predetermined motion time systems like GSD (General Sewing Data) or MODAPTS. SMV is not the time your fastest operator can do it in on a good day, and it's not the time your slowest trainee needs either — it's a standardized, repeatable benchmark.
SMV = Basic Time + Allowances (fatigue + personal + unavoidable delay)
Using the sleeve attach example above, if the combined allowance for that operation is 15%, the basic time of 0.825 minutes becomes an SMV of 0.825 × 1.15 ≈ 0.95 minutes — the number that would actually appear on the operation bulletin and get used for line balancing.
SMV is the foundation for almost everything in garment production planning:
- Calculating labor cost per garment
- Setting piece-rate wages
- Planning line capacity and delivery dates
- Balancing workload across operators
- Benchmarking operator and line efficiency
- Costing and quoting to buyers
Get SMV wrong, and every downstream calculation — capacity, manpower, delivery date, cost — is wrong too.
How SMV affects balancing: Line balancing is essentially an exercise in distributing total SMV as evenly as possible across the available workstations, while respecting takt time. If total garment SMV is 25 minutes and you have 25 operators, in a perfectly theoretical world each operator would handle exactly 1 minute of work. In reality, operations don't divide that neatly — some tasks are inherently 1.4 minutes, others 0.5 minutes — so the IE's job is to combine and split operations cleverly to get each workstation as close to takt time as possible.
Example calculation: A polo shirt has a total SMV of 18.5 minutes, made up of 28 individual operations ranging from 0.3 to 1.2 minutes each. The factory works an 8-hour shift (480 minutes) with a target line efficiency of 65%, so actual available minutes per operator = 480 × 0.65 = 312 minutes. For a single operation with SMV 0.5 minutes, daily capacity per operator = 312 ÷ 0.5 = 624 pieces possible from that workstation alone. Line capacity = 312 ÷ 18.5 (total garment SMV) × number of operators, adjusted by how many parallel stations exist at each operation.
Pro tip: Always re-verify SMV after any style change, fabric change, or trim change. A "similar" style can have a very different SMV if seam allowances, stitch counts, or fabric slipperiness change — even slightly.
Pitch Time
Pitch time is used mainly in bundle or batch production — it's the time it takes to complete a bundle of a given size at a given operation, rather than a single piece. It helps planners think in terms of batch flow rather than single-unit flow. Covered in full detail, with a worked example, later in this guide.
Workstation Allocation
The practical act of assigning specific operations — and the right number of machines and operators — to each workstation on the line, based on SMV, takt time, and operator skill, so the whole line moves at a consistent pace.
Manpower Balancing
SMV balancing tells you how much work is at each station. Manpower balancing answers a different, equally important question: how many people does each operation actually need — and what happens to the line's efficiency because operators can't be hired in fractions?
The Core Formula
Operators Required (Theoretical) = Operation SMV ÷ Takt Time
This number is almost never a whole integer. An operation with an SMV of 1.10 minutes against a 0.75-minute takt time needs 1.47 operators — but you can't assign 0.47 of a person to a sewing machine. In practice, you round up:
Actual Operators Assigned = Round Up (Theoretical Operators Required)
That rounding is where manpower gets "lost." Every operation that needs, say, 1.2 or 1.4 theoretical operators still gets a full second body if it's run as its own station, and the leftover 0.6–0.8 of that person's time each cycle goes unused unless the operation is deliberately combined with another light one.
Worked Example
Take a shirt line with a takt time of 0.75 minutes/piece and ten operations:
| Operation | SMV | Theoretical Operators (SMV ÷ Takt) | Practical Operators (rounded up) |
|---|---|---|---|
| Shoulder join | 0.55 | 0.73 | 1 |
| Collar attach | 1.10 | 1.47 | 2 |
| Collar top-stitch | 0.65 | 0.87 | 1 |
| Sleeve attach | 0.70 | 0.93 | 1 |
| Side seam | 0.60 | 0.80 | 1 |
| Sleeve hem | 0.50 | 0.67 | 1 |
| Bottom hem | 0.55 | 0.73 | 1 |
| Button hole | 0.30 | 0.40 | 1 |
| Button attach | 0.35 | 0.47 | 1 |
| Pocket attach | 0.90 | 1.20 | 2 |
| Total | 6.20 | 8.27 | 12 |
Theoretically, this line's work content only calls for 8.27 operators. But because each operation is run as its own station and fractional people don't exist, the line as built actually needs 12 operators — nearly 4 more bodies than the math says the work requires.
Manpower Efficiency (%) = Theoretical Operators Required ÷ Actual Operators Assigned × 100 = 8.27 ÷ 12 × 100 = 68.9%
That 31-point gap isn't a mistake — it's the structural cost of treating every operation as its own station. It's also exactly why "combine low-SMV operations" is one of the standard balancing moves: any two light operations whose theoretical operator counts add up to roughly 1.0 or less can share a single station instead of each claiming a full operator.
Recovering Manpower Through Combination
Button hole (0.40) and button attach (0.47) sum to 0.87 — comfortably under 1.0. Assigned to one multi-skilled operator instead of two separate stations, the line drops from 12 practical operators to 11, and manpower efficiency improves to 8.27 ÷ 11 × 100 = 75.2%, with zero change to output or takt time. This is the same logic pitch-time and SMV balancing both use — just applied directly to headcount instead of minutes.
Pro tip: Manpower efficiency is a useful companion metric to balance efficiency. Balance efficiency tells you how evenly time is spread across stations; manpower efficiency tells you how much headcount is being spent, or wasted, to achieve that spread. A line can have decent balance efficiency and still be overstaffed if too many operations were left as standalone stations instead of being combined.
Bottlenecks in Sewing Lines
A bottleneck is any workstation, operation, or resource whose capacity is lower than the rest of the line, causing it to restrict the overall output rate. The line, as a whole, can never produce faster than its bottleneck — full stop.
Common Causes
- An operation with unusually high SMV relative to others (e.g., collar attach, zipper insertion, complex embroidery placement)
- A single skilled operator assigned to a critical operation with no backup
- Machine breakdown or unavailability at a key station
- Poor operator skill or training at a specific operation
- Material feeding delays (cut panels not reaching the station on time)
- Quality checkpoints that create a queue (inspection, measurement)
- Uneven bundle sizes causing irregular flow
- Operators pulled away for other duties mid-shift
Identification Methods
| Method | How It Works |
|---|---|
| Line balancing chart | Plot the SMV or cycle time of each operation — the tallest bar is your bottleneck. |
| WIP accumulation observation | Walk the line physically; piles of unfinished bundles in front of a station reveal a bottleneck instantly. |
| Hourly production tracking | Compare hourly output of each workstation against target; the lowest-output station is the constraint. |
| Operator utilization study | Track idle time — stations with near-zero idle time and growing queues are bottlenecks; stations with high idle time are starved by an upstream one. |
Real Production Example: The Bar Tack Bottleneck
On a five-pocket denim jean line, the bar tack operation (reinforcing pocket corners and belt loops) was consistently 40% slower than the line average because the operator had to reposition the garment multiple times per cycle. WIP piled up visibly at that station — easily 60–80 pieces waiting at any given time — while downstream stations sat comparatively idle. The fix: adding a jig/fixture to reduce repositioning time, and splitting bar tack points between two machines. The bottleneck was resolved within three days.
Common mistake: Blaming the operator at the bottleneck station for being "slow," when the real issue is an unbalanced or poorly engineered operation. Always check the SMV and method before questioning the person.
Case Study 1: Rebalancing a Basic Polo Shirt Line
Numbers land better with a real line in front of you. A factory needs to produce 480 polo shirts in an 8-hour shift (480 minutes) — a clean 1-piece-per-minute target. Total garment work content across 20 operations comes to 8.25 SMV.
| Metric | Value |
|---|---|
| Target Output | 480 pieces/day |
| Garment SMV | 8.25 minutes |
| Takt Time | 1.00 minute/piece |
| Theoretical Operators | 8.25 → 9 |
Takt time comes out to a tidy 480 ÷ 480 = 1.00 minute per piece. Dividing work content by takt time (8.25 ÷ 1.00) says the theoretical minimum is 9 operators — but no single operation on this style exceeds 0.95 SMV, so on paper, nothing looks like it should bottleneck. That's the trap: individual operations fitting under takt time tells you nothing about whether the stations you group them into will.
The Operation Bulletin (Before Rebalancing)
| Station | Operations | SMV | vs. Takt |
|---|---|---|---|
| S1 | Collar make + Label attach | 0.85 | Under |
| S2 | Collar attach | 0.95 | Under |
| S3 | Front placket join + topstitch | 0.85 | Under |
| S4 | Shoulder join + topstitch | 0.75 | Under |
| S5 | Sleeve attach + Sleeve tack | 1.15 | Bottleneck |
| S6 | Sleeve hemming + Buttonhole | 0.85 | Under |
| S7 | Side seam + Button attach | 0.85 | Under |
| S8 | Bottom hem + Care label | 0.60 | Under |
| S9 | Trimming + Quality check | 0.55 | Under |
| S10 | Pressing + Folding | 0.60 | Under |
| S11 | Packing | 0.25 | Under |
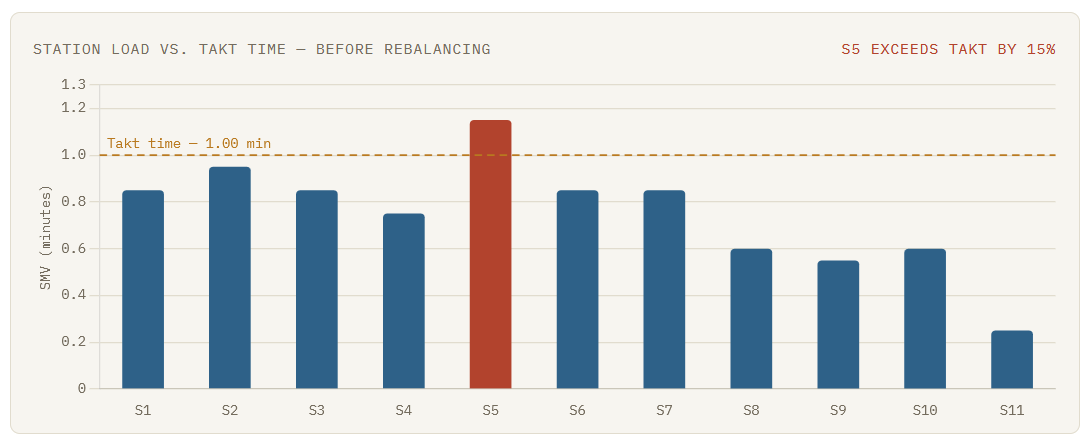
S5 — sleeve attach plus the small sleeve tack that got tacked onto it during line setup — runs at 1.15 minutes against a 1.00 minute takt. That 0.15-minute overage doesn't stay contained at S5. Every downstream station starves for 0.15 minutes per piece, all shift, and the line's real output collapses to whatever S5 can push through:
Actual Capacity = Available Minutes ÷ Longest Station Time = 480 ÷ 1.15 = 417 pieces/day (63 pieces short of the 480 target)
| Metric | Before |
|---|---|
| Balance Efficiency | 65.2% |
| Actual Output | 417 pieces/day |
| Shortfall vs. Target | −63 pieces |
The Fix
The supervisor's instinct here is usually to add a whole extra operator to S5 — but that overcorrects, since sleeve attach alone is only 0.85 SMV. The cleaner move is to simply pull the small sleeve tack operation (0.30 SMV) off S5 and hand it to S9, which had slack to spare at 0.55 SMV. Nothing about the machines or the operators changes — just where one 18-second task sits in the sequence.
The Operation Bulletin (After Rebalancing)
| Station | Operations | SMV | vs. Takt |
|---|---|---|---|
| S1 | Collar make + Label attach | 0.85 | Under |
| S2 | Collar attach | 0.95 | Under · new longest |
| S3 | Front placket join + topstitch | 0.85 | Under |
| S4 | Shoulder join + topstitch | 0.75 | Under |
| S5 | Sleeve attach | 0.85 | Under |
| S6 | Sleeve hemming + Buttonhole | 0.85 | Under |
| S7 | Side seam + Button attach | 0.85 | Under |
| S8 | Bottom hem + Care label | 0.60 | Under |
| S9 | Trimming + Quality check + Sleeve tack | 0.85 | Under |
| S10 | Pressing + Folding | 0.60 | Under |
| S11 | Packing | 0.25 | Under |
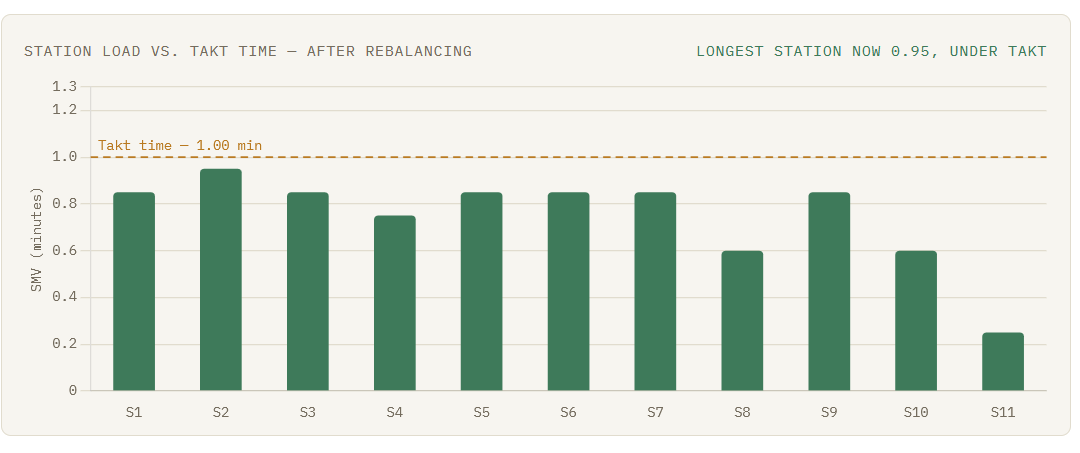
Collar attach, at 0.95 SMV, is now the longest single station — and since it's already under the 1.00 minute takt, the line's ceiling lifts accordingly:
New Capacity = 480 ÷ 0.95 = 505 pieces/day (25 pieces above target)
| Metric | After | Change |
|---|---|---|
| Balance Efficiency | 78.9% | ▲ 13.7 points |
| Actual Output | 505 pieces/day | ▲ 88 pieces |
| vs. Target | +25 pieces | — |
Same 11 operators, same machines, same skill levels. Moving one 18-second task from an overloaded station to one with room took the line from missing target by 63 pieces to beating it by 25 — an 88-piece daily swing from a change that cost nothing to implement.
What the First Week on the Rebalanced Line Looked Like
A rebalance doesn't produce its full result on day one — operators need a day or two to settle into the new sequence. This is the kind of ramp-up curve an IE would actually track on the floor:
| Day | Line Efficiency |
|---|---|
| Day 1 | 66.5% |
| Day 2 | 69.8% |
| Day 3 | 73.1% |
| Day 4 | 75.6% |
| Day 5 | 78.2% |
| Day 6 | 78.7% |
| Day 7 | 78.9% |
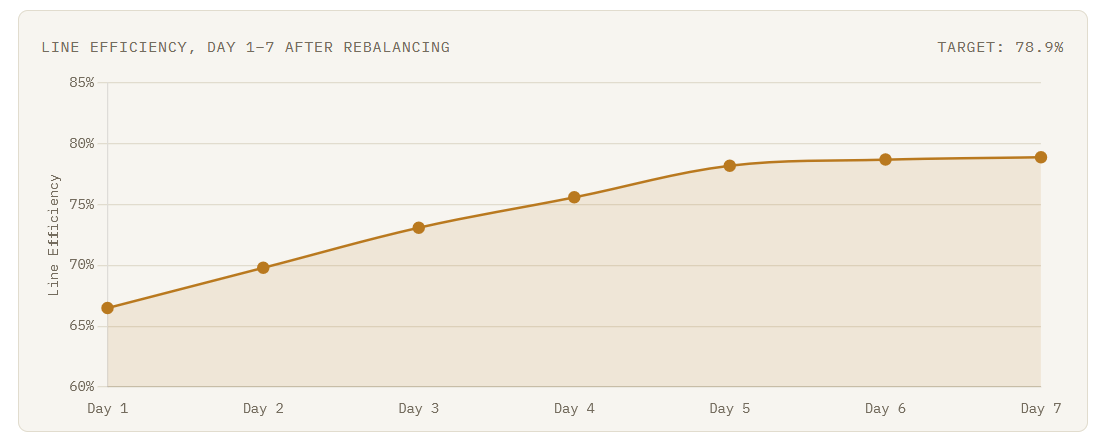
By day 5 the line is essentially holding its theoretical balance efficiency — the real signal that a rebalance has "taken," rather than the first-day number, which is almost always lower than the math predicts.
Case Study 2: Six Ways to Evaluate the Same Line
Different balancing systems measure the same line differently. Here's one consistent scenario run through six formulas, so you can see how the same line would be evaluated depending on which system it's using.
The scenario: a basic crew-neck T-shirt.
| Input | Value |
|---|---|
| Garment SMV | 10 minutes |
| Shift time | 480 minutes (8 hours) |
| Operators on the line | 25 |
| Target output | 900 pieces/day |
| Bundle size (where used) | 20 pieces |
Takt time first, since everything else is measured against it:
Takt Time = Available Working Time ÷ Required Output = 480 ÷ 900 = 0.53 minutes/piece
Every station needs to produce roughly one piece every 32 seconds to hit the 900-piece target.
1. Manual Balancing — Line Efficiency
Say the supervisor eyeballs the assignments and the line actually produces 640 pieces that day.
Line Efficiency (%) = (Output × SMV) ÷ (Operators × Minutes Worked) × 100 = (640 × 10) ÷ (25 × 480) × 100 = 6,400 ÷ 12,000 × 100 = 53.3%
A mediocre result — typical of manual balancing without data backing it up. The supervisor "felt" the line was working fine, but the numbers show over 45% of paid capacity was lost.
2. Computer-Assisted Balancing — Balance Efficiency
Software recalculates station assignments and reports individual station cycle times across 8 key stations (minutes): 0.50, 0.52, 0.55, 0.48, 0.53, 0.50, 0.51, 0.60. The slowest station is 0.60 minutes.
Balance Efficiency (%) = Sum of Station Times ÷ (Stations × Slowest Time) × 100 Sum = 4.19 → (4.19 ÷ (8 × 0.60)) × 100 = (4.19 ÷ 4.80) × 100 = 87.3%
A strong balance — most stations are clustered close to takt time (0.53), with only the 0.60-minute station slightly dragging.
3. Progressive Bundle System (PBS) — WIP
Same line, but running on PBS with 20-piece bundles queued at 8 stations before pickup.
WIP = Bundle Size × Number of Stations in Queue = 20 × 8 = 160 pieces
That's 160 T-shirts sitting half-finished on the floor at any given moment — tying up space and hiding potential quality issues until someone finally opens those bundles.
4. Unit Production System (UPS) — Throughput Time
Same garment (SMV = 10 minutes), moving one piece at a time on an overhead rail with negligible queue time — say, 0.2 minutes total transport/queue per piece.
Throughput Time = Total Work Content (SMV) + Transport/Queue Time = 10 + 0.2 = 10.2 minutes
Compare that to PBS: with 160 pieces of WIP sitting in bundles at various stages, a single garment could realistically take hours to clear the whole line, even though the actual sewing work is only 10 minutes. UPS collapses that gap dramatically.
5. Modular Production — Team Capacity
Now split into a 6-person modular team instead of a straight-line layout.
Team Capacity = Total Team Minutes ÷ Garment SMV Total Team Minutes = 6 operators × 480 minutes = 2,880 Team Capacity = 2,880 ÷ 10 = 288 pieces/day (for that one cell)
If the factory runs 3 such modular cells in parallel, total capacity = 288 × 3 = 864 pieces/day — close to the 900-piece target, achieved through flexible teams rather than a rigid station-by-station line.
6. Lean Balancing — Takt Time Check
Lean balancing asks: how close does actual cycle time come to the 0.53-minute takt time calculated at the start? Using the computer-assisted example above, station cycle times ranged from 0.48 to 0.60 — all within about 13% of the 0.53 takt time target. That's a tight, lean-balanced line. Anything drifting much beyond ±15–20% of takt time is a signal for kaizen intervention.
Quick Reference
| Type | Formula Used | What It Measures |
|---|---|---|
| Manual Balancing | Line Efficiency % | Overall output vs. potential |
| Computer-Assisted | Balance Efficiency % | Evenness of work distribution |
| Progressive Bundle System | WIP = Bundle Size × Stations Queued | Work piling up in the line |
| Unit Production System | Throughput Time = SMV + Queue Time | Speed from cut to finished piece |
| Modular Production | Team Capacity = Team Minutes ÷ Garment SMV | Output of a self-managed cell |
| Lean Balancing | Takt Time = Available Time ÷ Demand | Required pace to meet customer demand |
Pro tip: If you only remember one formula from this whole comparison, make it takt time — it's the reference point every other system, formula, and balancing decision is ultimately trying to match.
Pitch Time, in Depth
What Pitch Time Is
Pitch time is the time it takes to complete an entire bundle at a given operation — not just one piece. It's mainly used in bundle-based systems (like PBS) where operators work bundle by bundle rather than piece by piece, and it matters for scheduling, WIP planning, and line balancing at the bundle level.
Pitch Time = SMV of Operation × Bundle Size
Applying It to the T-Shirt Scenario
Using the same T-shirt line (garment SMV = 10 minutes total, bundle size = 20 pieces), take one specific operation — sleeve attach, with an SMV of 0.53 minutes, close to takt time and one of the balanced stations from the computer-assisted example.
Pitch Time = SMV × Bundle Size = 0.53 × 20 = 10.6 minutes
It takes 10.6 minutes for one operator to completely finish sewing sleeves onto an entire 20-piece bundle before that bundle can move to the next station.
Why This Matters for Balancing
| Operation | SMV (min) | Bundle Size | Pitch Time (min) |
|---|---|---|---|
| Shoulder join | 0.48 | 20 | 9.6 |
| Sleeve attach | 0.53 | 20 | 10.6 |
| Collar attach | 0.60 | 20 | 12.0 |
| Bottom hem | 0.50 | 20 | 10.0 |
Collar attach has the longest pitch time (12.0 minutes) — every bundle sits at that station 2.4 minutes longer than at shoulder join. Multiply that gap across dozens of bundles a day, and collar attach becomes the bottleneck that paces the entire line, exactly like the SMV-only view showed — but pitch time makes the bundle-level delay concrete and visible to supervisors managing physical bundle flow.
Calculating Bundles Processed Per Day
Bundles per Day = Available Working Minutes ÷ Pitch Time
For collar attach (480 minutes available): Bundles per Day = 480 ÷ 12.0 = 40 bundles → Pieces per Day = 40 × 20 = 800 pieces.
For shoulder join: Bundles per Day = 480 ÷ 9.6 = 50 bundles → Pieces per Day = 50 × 20 = 1,000 pieces.
Even though both stations run full bundles all day, collar attach caps the whole line at 800 pieces/day, while shoulder join alone could've supported 1,000. This is the pitch-time version of the same bottleneck story, measured in bundle terms instead of single-piece terms — more useful when supervisors are managing physical bundles rather than tracking individual garments.
Pro tip: In PBS lines, pitch time is often more actionable on the floor than raw SMV, because supervisors can see bundles sitting at a station — they can't see 0.60 minutes, but they can see a bundle that hasn't moved in 12 minutes while the next one waits.
Balancing by Pitch Time, Step by Step
Balancing by pitch time follows the same logic as SMV-based balancing, but instead of targeting takt time per piece, you're targeting a common pitch time per bundle across every station.
Step 1 — Calculate target pitch time. Just like takt time is your target for single-piece balancing, you need a target pitch time for bundle balancing:
Target Pitch Time = Takt Time × Bundle Size = 0.53 × 20 = 10.6 minutes
This is the pitch time every station should be close to if the line is going to move 900 pieces/day smoothly, bundle by bundle.
Step 2 — List every operation's natural pitch time (SMV × bundle size):
| Operation | SMV | Pitch Time (SMV × 20) |
|---|---|---|
| Shoulder join | 0.48 | 9.6 |
| Sleeve attach | 0.53 | 10.6 |
| Collar attach | 0.60 | 12.0 |
| Side seam | 0.50 | 10.0 |
| Bottom hem | 0.45 | 9.0 |
| Sleeve hem | 0.40 | 8.0 |
| Label attach | 0.20 | 4.0 |
| Trimming | 0.25 | 5.0 |
Target pitch time = 10.6 minutes. Anything sitting well above or below that number needs adjusting.
Step 3 — Flag stations above target (bottlenecks). Collar attach at 12.0 minutes is 1.4 minutes over target — same conclusion as before, just visible in bundle terms. Fix options:
- Split the bundle across two operators working in parallel on the same operation, cutting effective pitch time roughly in half (12.0 ÷ 2 = 6.0 minutes).
- Reduce bundle size just for that operation (e.g., feed collar attach in 10-piece sub-bundles instead of 20), which halves pitch time to 6.0 minutes without needing a second machine — though it increases handling frequency, so weigh that tradeoff.
- Simplify the method (add a guide/jig) to bring SMV itself down, which lowers pitch time proportionally.
Step 4 — Flag stations below target (underloaded). Label attach (4.0 min) and trimming (5.0 min) are both well under the 10.6-minute target — these operators finish their bundles fast and then wait. Fix: combine operations onto a single operator:
Combined Pitch Time = 4.0 + 5.0 = 9.0 minutes
Close to target, and a whole workstation's worth of manpower is freed up.
Step 5 — Rebalance and recheck. After combining and splitting, the pitch times cluster near 10.6 minutes:
| Operation (after rebalancing) | Pitch Time |
|---|---|
| Shoulder join | 9.6 |
| Sleeve attach | 10.6 |
| Collar attach (split 2 ways) | 6.0 |
| Side seam | 10.0 |
| Bottom hem | 9.0 |
| Sleeve hem | 8.0 |
| Label attach + Trimming (combined) | 9.0 |
Still a bit of spread, but nothing over target anymore — collar attach went from the worst offender (12.0) to comfortably under target once split.
Step 6 — Verify against the daily output target. The new bottleneck is sleeve attach at 10.6 min, right at target:
Bundles per Day = 480 ÷ 10.6 = 45.3 bundles → Pieces per Day = 45.3 × 20 ≈ 906 pieces
That clears the 900-piece target — the line is now balanced by pitch time, not just by individual SMV.
Quick Reference: How to Balance by Pitch Time
- Calculate target pitch time (takt time × bundle size).
- List actual pitch time for every operation (SMV × bundle size).
- Identify stations above target → split operator, shrink sub-bundle size, or improve method.
- Identify stations below target → combine with another light operation.
- Rebalance and recalculate pitch times for the new station layout.
- Verify bundles/day and pieces/day hit your daily target.
- Repeat whenever bundle size, SMV, or takt time changes.
Pro tip: Pitch time balancing is especially useful when you're managing bundle size as a lever, not just manpower. Sometimes the cheapest fix for a bottleneck isn't adding a person — it's simply shrinking the bundle size at that one station so bundles clear faster and stop piling up.
Case Study 3: The Placket and Collar Bottleneck
A basic polo shirt with an SMV of 15 minutes, produced on a line targeting 480 pieces per 8-hour shift.
| Operation | Machine | SMV (min) |
|---|---|---|
| Shoulder join | Overlock | 0.55 |
| Collar attach | Single needle | 1.10 |
| Collar top-stitch | Single needle | 0.65 |
| Placket attach | Single needle | 1.20 |
| Sleeve attach | Overlock | 0.70 |
| Side seam | Overlock | 0.60 |
| Sleeve hem | Flatlock | 0.50 |
| Bottom hem | Flatlock | 0.55 |
| Button hole | Buttonholer | 0.30 |
| Button attach | Button machine | 0.35 |
| Pocket attach | Single needle | 0.90 |
| Label attach | Single needle | 0.25 |
| Trimming & thread cutting | Manual | 0.40 |
| Final pressing | Iron/press | 0.80 |
| Total (subset shown) | 8.85 — full style SMV = 15.0 with additional finishing steps |
Before balancing: the factory assigned one operator per listed operation, without splitting the high-SMV tasks. Placket attach (1.20 min) and collar attach (1.10 min) became clear bottlenecks against a takt time of roughly 0.60 minutes. Daily output stalled at around 340 pieces, and WIP piled up heavily in front of the placket and collar stations.
After balancing: the IE team split placket attach across two operators (each handling half the placket length in a two-pass method) and added a second collar-attach station. Lower-SMV operations like label attach (0.25) and button hole (0.30) were combined onto a single workstation handled by one multi-skilled operator. The line was re-sequenced so that station cycle times clustered between 0.55 and 0.70 minutes — much closer to takt time.
| Metric | Before | After |
|---|---|---|
| Bottleneck SMV | 1.20 min | 0.70 min |
| Daily Output | 340 pcs | 470 pcs |
| Line Efficiency | 61% | 84% |
| WIP at Bottleneck | 90+ pieces | 15–20 pieces |
Efficiency improvement: roughly 23 percentage points, and a 38% jump in daily output — achieved without adding headcount, just redistributing work correctly.
Factors Affecting Garment Line Balancing
Line balancing isn't a one-time calculation you do and forget — it's affected by dozens of variables, many of which change daily.
| Category | Factors |
|---|---|
| Human | Operator skill level, learning curve, motivation, absenteeism |
| Machine | Machine speed and condition, breakdown frequency, machine availability (e.g., only one bartack machine) |
| Material | Fabric quality/type, fabric defects, trim availability, material shortages |
| Production | Style complexity, bundle size, line layout, quality issues/rejects, rework, changeover time |
| Feeding & Flow | Feeding system (bundle, UPS, manual), material handling distance |
| Management | Line supervision quality, industrial engineering support, training programs, production planning accuracy, production scheduling |
| People Systems | Operator motivation and incentive structure, workstation ergonomics, auxiliary equipment (folders, guides, jigs) |
Did you know? Studies by apparel productivity consultancies have found that layout and material handling inefficiencies alone can account for up to 15–20% of "hidden" lost time on a sewing line — time that never shows up as a formal bottleneck but drags down overall balance.
Step-by-Step Line Balancing Process
| Step | Action | Notes |
|---|---|---|
| 1 | Study the Operation Bulletin (OB) | The operation breakdown for the style — every sewing, pressing, and finishing step, in sequence, with machine type specified. |
| 2 | Analyze SMV | Confirm or establish SMV using time study or predetermined motion time systems (GSD, MODAPTS). Don't copy SMV from a "similar" past style without verification. |
| 3 | Calculate capacity | Determine theoretical capacity based on available time, target efficiency, and total SMV. |
| 4 | Determine manpower | Operators needed = SMV of operation ÷ Takt time. |
| 5 | Allocate machines | Match machine types to operations and confirm availability matches the manpower plan. |
| 6 | Balance operations | Combine low-SMV operations onto a single workstation and split high-SMV operations across multiple stations to bring every station close to takt time. |
| 7 | Pilot run | Run a small trial batch ("pilot" or "hot run") to validate the plan before full ramp-up. |
| 8 | Observe bottlenecks | Track WIP buildup, idle time, and hourly output at every station during the pilot. |
| 9 | Improve balance | Adjust manpower, method, or machine allocation based on pilot observations. |
| 10 | Monitor continuously | Track hourly output, absenteeism, and bottleneck shifts daily; re-balance whenever conditions change. |
Pro tip: Keep a "living" line balancing chart on the floor (physical or digital) that supervisors update at least twice a shift. Static balancing charts made once at style start-up and never revisited are one of the most common reasons lines drift out of balance within days.
Formulas, Collected
| Metric | Formula |
|---|---|
| Work Content | Sum of the SMV of every operation |
| Basic Time | Observed Time × (Rating ÷ 100) |
| SMV | Basic Time + Allowances |
| Takt Time | Available Working Time ÷ Required Output |
| Capacity | Available Minutes ÷ SMV |
| Pitch Time | SMV of Operation × Bundle Size |
| Operators Needed (Theoretical) | SMV of Operation ÷ Takt Time |
| Actual Operators Assigned | Round Up (Theoretical Operators Required) |
| Manpower Efficiency | Theoretical Operators Required ÷ Actual Operators Assigned × 100 |
| Line Efficiency | (Output × SMV) ÷ (Operators × Working Minutes) × 100 |
| Balance Efficiency | Sum of Station Times ÷ (Stations × Slowest Station Time) × 100 |
| Line Capacity | (Available Minutes × Operators × Target Efficiency%) ÷ SMV |
| Hourly Production Target | (60 ÷ SMV) × Target Efficiency% |
| Operator Efficiency | (Pieces Produced × SMV) ÷ Minutes Worked × 100 |
| Machine Utilization | (Actual Running Time ÷ Available Time) × 100 |
| WIP (bundle systems) | Bundle Size × Number of Stations Queued |
| Throughput Time (UPS) | Total Work Content (SMV) + Transport/Queue Time |
| Team Capacity (modular) | Total Team Minutes ÷ Garment SMV |
One More Worked Example
A line has 30 operators, works 480 minutes/day, and the garment SMV is 20 minutes, with a target efficiency of 70%.
Daily Capacity = (480 × 30 × 0.70) ÷ 20 = 504 pieces/day
If actual output was 470 pieces:
Line Efficiency = (470 × 20) ÷ (30 × 480) × 100 = 9,400 ÷ 14,400 × 100 = 65.3%
The gap between the 70% target and the 65.3% actual is exactly the kind of shortfall line balancing analysis is designed to explain and close.
Common Line Balancing Problems
| Problem | Symptom | Solution |
|---|---|---|
| Ignoring SMV verification | Using outdated or copied SMV data | Re-verify SMV for every new style via time study |
| Static balancing charts | Created once, never updated | Review balance at least twice per shift |
| Uneven operator skill distribution | Best operators clustered on easy operations | Match skill level deliberately to operation difficulty |
| Ignoring machine constraints | Balancing manpower without checking machine availability | Cross-check machine allocation before finalizing |
| Poor bundle sizing | Bundles too large or too small disrupt flow | Standardize bundle size based on line speed |
| No pilot run | Jumping straight to full production | Always run a small pilot batch first |
| Absenteeism not planned for | No backup operators for critical operations | Maintain a trained floating/backup pool |
| Poor layout | Excessive walking or handling distance between stations | Redesign layout for minimal material travel |
| Overlooking rework time | SMV doesn't include rework, but it eats capacity | Track and separately account for rework minutes |
| Feeding delays | Cut panels not reaching the line on time | Coordinate cutting room output with line start dates |
| Changeover disruption | Style/size changes without a re-balancing plan | Prepare a changeover balancing plan in advance |
| Bottleneck misdiagnosis | Blaming the operator instead of the method or SMV | Use data (WIP, cycle time) before assigning blame |
| No real-time monitoring | Problems discovered only at end-of-day reporting | Use hourly production boards or digital tracking |
| Over-reliance on software output | Trusting computer balance without floor validation | Always validate software recommendations with pilot run data |
| Neglecting operator fatigue | Balance calculated for "fresh" pace, ignoring afternoon slowdown | Build small allowances into SMV and monitor late-shift output separately |
Best Practices for Better Line Balancing
- Always verify SMV through actual time study before trusting historical data.
- Conduct a pilot run before full production ramp-up for every new style.
- Keep line balancing charts visible and updated on the shop floor.
- Cross-train operators on at least 2–3 operations to allow flexible reassignment.
- Match operator skill level to operation complexity deliberately.
- Standardize bundle sizes appropriate to the line's speed and style.
- Track hourly output per station, not just end-of-day totals.
- Maintain a trained "floating" operator pool to cover absenteeism.
- Use jigs, guides, and attachments to reduce cycle time on high-SMV operations.
- Involve operators in identifying bottlenecks — they often see problems before the IE does.
- Re-balance immediately after any style, fabric, or trim change.
- Coordinate closely with the cutting room to prevent feeding delays.
- Use computer-assisted balancing tools for complex, multi-operation styles.
- Set realistic efficiency targets based on style complexity, not blanket factory averages.
- Separate rework time from standard SMV in your reporting.
- Design line layout to minimize walking and handling distance.
- Hold a brief daily huddle with supervisors to review the previous day's bottlenecks.
- Rotate operators periodically to prevent fatigue-related slowdown at repetitive stations.
- Invest in preventive machine maintenance to avoid breakdown-driven imbalance.
- Use visual management (red/yellow/green cards) to flag stations falling behind in real time.
- Build in a small buffer WIP between stations to absorb minor speed variation — without letting it grow uncontrolled.
- Review balance weekly even on "stable" running styles, since drift happens gradually.
- Document lessons learned from each style for faster balancing next time a similar style runs.
- Empower line supervisors with basic IE training so they can make small real-time adjustments.
- Align incentive/piece-rate structures so operators aren't penalized for helping at a bottleneck station.
- Benchmark against industry-standard efficiency ranges (typically 55–85% depending on style complexity and factory maturity) to set achievable, motivating targets.
Lean Manufacturing and Line Balancing
Line balancing doesn't exist in a vacuum — it's deeply connected to lean manufacturing principles, and the best-performing factories treat it as one piece of a broader continuous improvement system.
Lean is fundamentally about eliminating waste — and an unbalanced line is a textbook example of waste: waiting time, overproduction at fast stations, and excess WIP at bottlenecks are three of the classic "seven wastes" showing up directly on the sewing floor.
Kaizen, the practice of continuous, incremental improvement, is what keeps a balanced line balanced. A line balanced perfectly on day one will drift by day five without ongoing small adjustments — kaizen is the mechanism for catching and correcting that drift.
Standard Work ties directly to SMV and method study — without a clearly defined standard method for each operation, you can't reliably measure or balance cycle time at all.
5S (Sort, Set in order, Shine, Standardize, Sustain) supports balancing indirectly but powerfully: a disorganized workstation adds seconds of searching and reaching to every cycle, which distorts your carefully calculated SMV.
Continuous Improvement and Waste Reduction are the outcomes you get when balancing is treated as an ongoing discipline rather than a one-time setup task at style start.
Pro tip: Factories that combine lean culture with rigorous IE-driven line balancing consistently outperform factories that use only one or the other. The math (balancing) tells you where the problem is; the lean mindset (kaizen) gives your team the habit of fixing it continuously.
Role of Industrial Engineers
Industrial engineers are the backbone of effective line balancing. Their day-to-day responsibilities typically include:
- Time study — measuring actual cycle times on the floor using stopwatch or video methods to establish or verify SMV.
- Motion study — analyzing operator hand and body movements to eliminate unnecessary motion and reduce cycle time.
- Capacity planning — calculating line and factory capacity to support realistic order booking and delivery commitments.
- Skill matrix management — maintaining an up-to-date record of which operators can perform which operations, at what proficiency level.
- Workstation balancing — the core task of allocating operations and manpower to achieve the most even distribution of work possible.
- Performance analysis — tracking line efficiency, operator efficiency, and bottleneck trends, and reporting them to production management.
A strong IE department doesn't just calculate numbers once — it's on the floor daily, walking the line, watching WIP, and adjusting the plan in real time as conditions change.
Software Used for Line Balancing
| Software | Strengths | Limitations |
|---|---|---|
| GSD (General Sewing Data) | Predetermined motion time system; generates accurate SMV without stopwatch time study | Requires trained analysts; upfront licensing cost |
| Avanti Systems | Widely used for production planning, line balancing, and costing in large factories | Can be complex to implement; needs clean master data |
| FastReact | Strong at real-time line balancing, planning, and efficiency tracking | Subscription cost; learning curve for new users |
| Coats Digital (GSD/Kesin) | Integrated suite for line balancing, planning, and costing from a globally recognized apparel supplier | Best value at scale; smaller factories may find it more than they need |
| ProSMV | Focused SMV calculation and line balancing tool | Narrower scope than full ERP-style suites |
| SAP (Apparel & Footwear module) | Enterprise-wide integration of planning, balancing, and ERP data | High cost and implementation complexity; often overkill for smaller operations |
| Centric PLM | Strong for product lifecycle management with some planning integration | Not a dedicated line balancing tool; usually paired with other software |
| Excel | Free, flexible, easy to customize for smaller factories or specific styles | Manual, error-prone at scale, no real-time floor integration |
Pro tip: Even factories with advanced software still benefit from a basic Excel-based balancing chart as a floor-level backup — software tells you the plan, but the floor tells you the truth.
KPIs to Measure Line Balancing
| KPI | Formula | What It Tells You |
|---|---|---|
| Line Efficiency | (Output × SMV) ÷ (Operators × Minutes Worked) × 100 | Overall productivity of the line relative to its potential |
| Balance Efficiency | Sum of Station Times ÷ (Stations × Slowest Station Time) × 100 | Evenness of work distribution across stations |
| DHU (Defects per Hundred Units) | (Total Defects ÷ Total Inspected) × 100 | Quality performance, often linked to rushed bottleneck stations |
| WIP | Physical count of unfinished bundles between stations | Flow smoothness; high WIP signals a bottleneck |
| Output | Total pieces produced in a period | Raw production volume |
| Productivity | Output ÷ (Operators × Hours) | Output per labor hour |
| Machine Utilization | (Actual Running Time ÷ Available Time) × 100 | How well machine capacity is being used |
| Operator Utilization | (Productive Time ÷ Total Time) × 100 | How much of an operator's paid time is spent producing |
| Absenteeism | (Absent Operators ÷ Total Operators) × 100 | Direct predictor of daily balance disruption |
| Throughput Time | Time from cutting to finished garment | Speed of flow through the line; balance directly affects this |
Where This Is Headed
The next generation of line balancing is being shaped by technology that would have seemed like science fiction to IE teams a couple of decades ago.
AI-driven balancing is starting to move beyond static SMV tables toward predictive models that adjust workstation assignments in near real-time based on actual observed performance, not just planned SMV.
Digital twins — virtual, data-driven replicas of a sewing line — let planners simulate different balancing scenarios before ever touching the physical floor, dramatically shortening pilot-run cycles.
Smart factories and IoT-enabled machines now stream live cycle-time and downtime data directly from sewing machines, giving IEs far more granular data than a stopwatch ever could.
Real-time production monitoring dashboards mean bottlenecks can be spotted and corrected within minutes rather than discovered at end-of-shift reporting.
Industry 4.0 broadly is pushing garment manufacturing toward connected, data-rich production environments where line balancing becomes a continuously optimized process rather than a static plan set once at style start.
Data analytics across historical style data is allowing factories to predict likely bottlenecks for new styles before production even begins, based on pattern similarity to past styles.
None of this replaces the fundamentals in this guide — SMV, takt time, capacity, and the willingness to walk the floor. It just gives IEs faster, richer information to apply those fundamentals more precisely.
Frequently Asked Questions
| Question | Answer |
|---|---|
| What is garment line balancing in simple terms? | The process of spreading the total sewing work of a garment evenly across all operators on a line so no single station slows down the whole line. |
| Why is line balancing important in apparel manufacturing? | It directly determines line efficiency, output, delivery performance, cost, and quality — unbalanced lines waste labor capacity even when everyone appears busy. |
| What is SMV and how is it different from cycle time? | SMV is the standardized time for an operation at normal pace with allowances built in; cycle time is the actual measured time an operator takes, which can vary from SMV. |
| How do you calculate line efficiency? | Line Efficiency (%) = (Output × Garment SMV) ÷ (Number of Operators × Minutes Worked) × 100. |
| What causes bottlenecks in sewing lines? | High-SMV operations, machine breakdowns, poor operator skill match, feeding delays, and material shortages are the most common causes. |
| What is takt time and why does it matter for balancing? | Takt time is the required pace of production to meet demand; every workstation should ideally operate at or near this pace for the line to be balanced. |
| How many operators should a sewing line have? | It depends on garment SMV, takt time, and target output — calculated as total SMV divided by takt time, rounded up per operation, then summed. |
| What's the difference between line balancing and capacity planning? | Capacity planning determines how much a line can produce; line balancing determines how that capacity is achieved by distributing work evenly across stations. |
| What software is best for line balancing? | It depends on factory size and budget — GSD and FastReact are strong for larger operations, while smaller factories often manage well with a disciplined Excel-based system. |
| How often should a line be re-balanced? | Whenever style, fabric, or trim changes, and ideally reviewed at least twice per shift even on stable-running styles, since drift happens naturally. |
| What is balance efficiency (line balance %)? | It measures how evenly work is spread across stations, calculated by comparing the sum of individual station times against the slowest station's time multiplied by the number of stations. |
| Can line balancing improve without adding machines or operators? | Yes — in most cases, redistributing existing work content correctly delivers the biggest efficiency gains, often 15–30%, without any additional resources. |
| What is the role of an industrial engineer in line balancing? | IEs conduct time studies, calculate SMV and capacity, design the balancing plan, run pilot batches, and continuously monitor and adjust the line. |
| How does operator skill affect line balancing? | Mismatched skill — placing a less experienced operator on a high-difficulty operation — creates artificial bottlenecks regardless of how well the plan was calculated on paper. |
| What is the Progressive Bundle System (PBS)? | A traditional production method where bundles of cut pieces move sequentially from operator to operator, common in large-volume basic garment production. |
| What is Unit Production System (UPS)? | UPS uses an overhead conveyor to move individual garments directly to each operator one piece at a time, reducing WIP and improving bottleneck visibility. |
| How does modular production affect line balancing? | Small, multi-skilled teams sharing work flexibly can respond to emerging bottlenecks in real time, making modular lines inherently easier to keep balanced than rigid PBS lines. |
| What is a good line efficiency target for a garment factory? | Typical ranges run from 55% to 85% depending on style complexity, factory maturity, and automation level — simpler basics trend higher, complex outerwear trends lower. |
| How does WIP relate to line balancing? | Excess WIP piling up in front of a station is one of the clearest physical signs of a bottleneck and poor balance. |
| What is the impact of absenteeism on line balancing? | A missing operator at a critical operation instantly creates a new bottleneck, which is why trained floating/backup operators are essential to a resilient balancing plan. |
| How do pilot runs help with line balancing? | They validate the theoretical balancing plan against real floor conditions before scaling to full production, catching problems early when they're cheap to fix. |
| Does line balancing affect garment quality? | Yes — rushed operators at overloaded bottleneck stations tend to produce more defects, so balance and quality are closely linked. |
Balance, Not Busyness
Garment line balancing sits at the intersection of math, method, and floor discipline. It's not glamorous work — nobody puts "balanced 40 operations to within 0.05 minutes of takt time" on a highlight reel — but it is, quietly, one of the highest-leverage activities in the entire apparel production process. Factories that treat it as a living, daily discipline rather than a one-time setup task consistently outperform their competitors on efficiency, cost, delivery, and even quality.
Don't trust that a line is balanced just because everyone looks busy. Walk the floor. Look at the WIP piling up in front of stations. Compare hourly output between operations. Re-verify the SMV. The data will tell you where the imbalance is hiding, and fixing it is almost always cheaper and faster than expected.
Start with a single line tomorrow morning: pull the operation bulletin, re-check the SMV, and walk the floor watching for WIP buildup. The bottleneck is usually findable within the hour — and the difference in output shows before the week is out.
External References
- International Labour Organization (ILO) — Apparel Sector Productivity Reports
- Society of Manufacturing Engineers (SME) — Industrial Engineering Standards
- Coats Digital — GSD Predetermined Motion Time System Documentation
- FastReact Systems — Line Balancing and Production Planning Resources
- American Apparel & Footwear Association (AAFA) — Industry Reports
- Textile World — Apparel Manufacturing Technology Coverage
- Toyota Global — Toyota Production System and Lean Manufacturing Principles
- Massachusetts Institute of Technology (MIT) — Operations Management Research on Assembly Line Balancing
- Journal of the Textile Institute — Peer-Reviewed Apparel Production Studies
- World Bank — Apparel Industry Reports on Developing Economy Manufacturing
- Apparel Resources — Industry News and Case Studies
- Just Style — Global Apparel Manufacturing Analysis
- Bangladesh Garment Manufacturers and Exporters Association (BGMEA) — Industry Data
- International Apparel Federation (IAF) — Best Practice Publications
- Institute of Industrial and Systems Engineers (IISE) — Industrial Engineering Standards and Publications