This provides a comprehensive overview of global yarn prices in 2026, presenting typical wholesale and export-market pricing in both USD per kilogram (kg) and USD per pound (lb). The figures reflect commonly traded yarns sourced from major spinning regions including China, India, Pakistan, Bangladesh, Turkey, Vietnam, Indonesia, Central Asia, and other global textile manufacturing hubs.
The guide covers the most widely used yarn categories in the textile industry, including:
- Cotton yarns
- Polyester yarns
- Nylon yarns
- Acrylic yarns
- Wool yarns
- Silk yarns
- Blended yarns
- Recycled yarns
- Technical and specialty yarns
In addition to average market prices, the guide includes typical global price ranges, helping manufacturers, sourcing teams, merchandisers, textile traders, fabric mills, and costing professionals benchmark supplier quotations and estimate raw material costs more accurately.
Because yarn prices are influenced by fiber costs, yarn count, spinning technology, quality standards, certification requirements, and market conditions, actual quotations can vary significantly between suppliers and sourcing regions. Higher-count yarns, combed and compact yarns, certified sustainable yarns, and specialty fiber blends typically command premium pricing, while larger order volumes can often secure lower unit costs.
Whether you are costing fabric production, evaluating supplier offers, planning procurement strategies, or monitoring textile market trends, this global yarn price guide serves as a practical benchmarking tool for understanding current yarn market values and making informed sourcing decisions.
Global Yarn Prices, by Kg & Pound — 2026
Updated July 2026 · Prices in USD · Figures below represent typical global wholesale and export-market yarn prices sourced from major spinning regions including China, India, Pakistan, Bangladesh, Turkey, Vietnam, Indonesia, and Central Asia.
A reference for textile manufacturers, sourcing teams, merchandisers, knitters, weavers, fabric mills, and costing engineers: current global yarn price benchmarks presented in both USD per kilogram (kg) and USD per pound (lb), along with typical global price ranges.
Conversion used:
- 1 Kilogram = 2.2046 Pounds
- Price per Pound = Price per Kg ÷ 2.2046
Natural Fiber Yarns
| Yarn Type | Avg. Price/Kg (USD) | Avg. Price/Lb (USD) | Global Price Range/Kg (USD) | Typical Count | Notes |
|---|---|---|---|---|---|
| Cotton Carded OE | 2.20 | 1.00 | 1.70–3.20 | Ne 10–30 | Cost-effective open-end yarn |
| Cotton Carded Ring | 2.80 | 1.27 | 2.20–4.20 | Ne 20–40 | Standard apparel yarn |
| Cotton Combed Ring | 3.40 | 1.54 | 2.80–5.50 | Ne 20–60 | Higher-quality cotton yarn |
| Compact Cotton | 4.00 | 1.81 | 3.20–6.50 | Ne 30–80 | Better strength and evenness |
| Organic Cotton | 4.80 | 2.18 | 3.80–7.50 | Ne 20–60 | Certified sustainable yarn |
| Pima Cotton | 6.50 | 2.95 | 5.00–10.00 | Ne 40–80 | Premium extra-long staple cotton |
| Linen Yarn | 7.00 | 3.18 | 5.50–12.00 | Nm 8–40 | High-end woven fabrics |
| Hemp Yarn | 6.50 | 2.95 | 5.00–11.00 | Nm 6–30 | Sustainable natural fiber |
| Wool Yarn | 8.00 | 3.63 | 6.00–15.00 | Nm 20–80 | Knitwear and suiting |
| Merino Wool Yarn | 12.00 | 5.44 | 8.00–25.00 | Nm 30–120 | Fine premium wool |
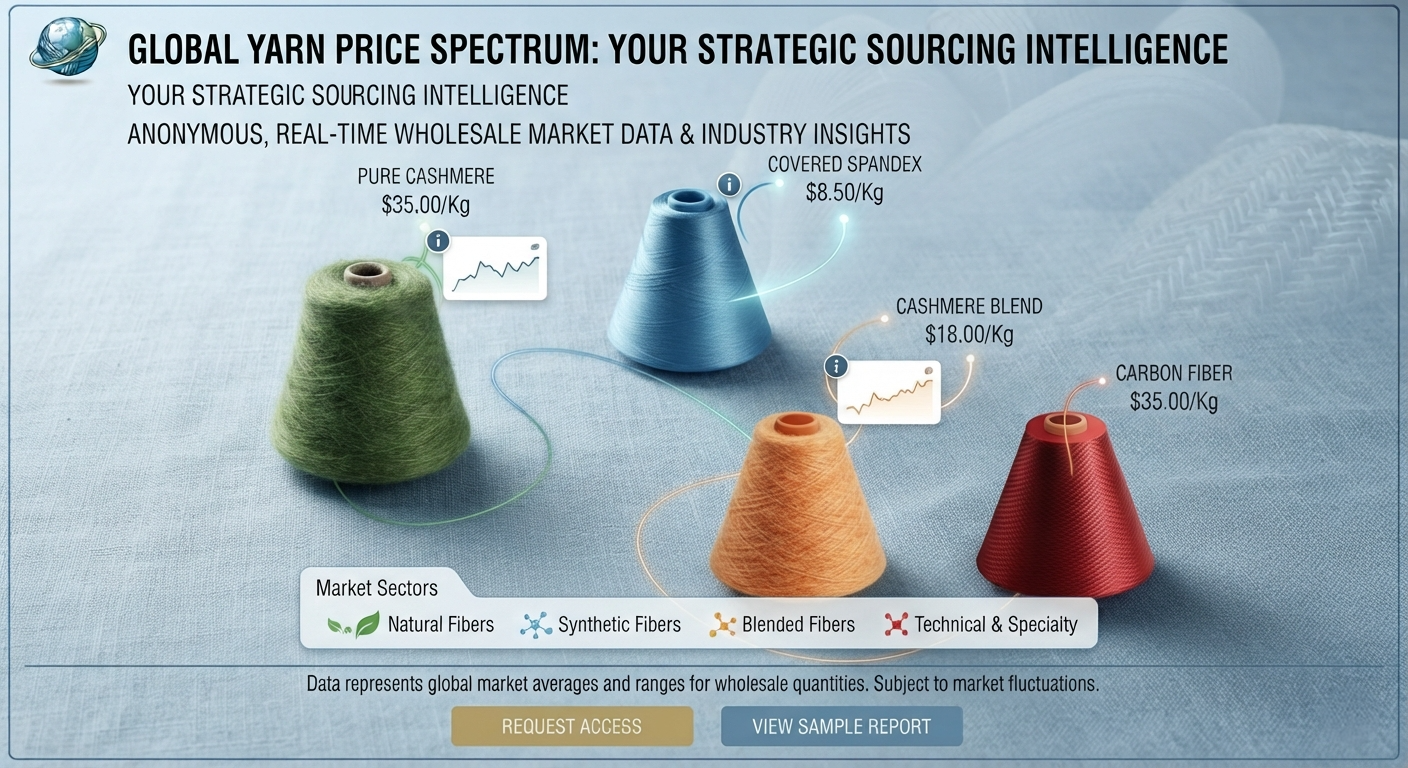
| Cashmere Blend Yarn | 18.00 | 8.16 | 12.00–35.00 | Nm 30–100 | Luxury knitwear |
| Pure Cashmere Yarn | 35.00 | 15.88 | 25.00–70.00 | Nm 40–120 | Highest luxury category |
| Mulberry Silk Yarn | 22.00 | 9.98 | 15.00–50.00 | Various | Premium silk applications |
Synthetic Yarns
| Yarn Type | Avg. Price/Kg (USD) | Avg. Price/Lb (USD) | Global Price Range/Kg (USD) | Notes |
|---|---|---|---|---|
| Polyester Spun Yarn | 1.80 | 0.82 | 1.30–2.80 | Most common synthetic yarn |
| Polyester Filament Yarn (FDY) | 1.60 | 0.73 | 1.20–2.50 | Smooth continuous filament |
| Polyester DTY | 1.70 | 0.77 | 1.30–2.70 | Textured filament yarn |
| Polyester ATY | 2.30 | 1.04 | 1.70–3.50 | Air-textured yarn |
| Recycled Polyester Yarn | 2.40 | 1.09 | 1.80–4.20 | Sustainable option |
| Nylon FDY | 2.80 | 1.27 | 2.00–4.50 | High-strength applications |
| Nylon DTY | 3.00 | 1.36 | 2.20–5.00 | Sportswear and hosiery |
| Acrylic Yarn | 2.60 | 1.18 | 1.80–4.50 | Sweater and knitwear use |
| Polypropylene Yarn | 1.90 | 0.86 | 1.40–3.20 | Industrial applications |
| Spandex Yarn | 6.50 | 2.95 | 4.50–10.00 | Stretch fabrics |
| Covered Spandex Yarn | 8.50 | 3.86 | 6.00–14.00 | Premium stretch fabrics |
Blended Yarns
| Yarn Type | Avg. Price/Kg (USD) | Avg. Price/Lb (USD) | Global Price Range/Kg (USD) | Notes |
|---|---|---|---|---|
| TC Yarn (65/35) | 2.20 | 1.00 | 1.70–3.50 | Polyester-cotton blend |
| CVC Yarn (60/40) | 2.80 | 1.27 | 2.20–4.50 | Cotton-rich blend |
| Poly-Cotton Ring Yarn | 2.60 | 1.18 | 2.00–4.20 | Apparel and home textiles |
| Cotton-Spandex Core Yarn | 4.20 | 1.90 | 3.20–6.50 | Stretch garments |
| Polyester-Spandex Core Yarn | 3.20 | 1.45 | 2.50–5.00 | Activewear applications |
| Modal Blend Yarn | 4.50 | 2.04 | 3.50–7.50 | Soft premium handle |
| Tencel Blend Yarn | 4.80 | 2.18 | 3.80–8.00 | Sustainable premium yarn |
| Bamboo Blend Yarn | 4.20 | 1.90 | 3.20–7.00 | Eco-focused products |
| Wool-Nylon Blend | 8.50 | 3.86 | 6.00–15.00 | Improved durability |
| Cashmere Blend Yarn | 18.00 | 8.16 | 12.00–35.00 | Luxury knitwear |
Technical & Specialty Yarns
| Yarn Type | Avg. Price/Kg (USD) | Avg. Price/Lb (USD) | Global Price Range/Kg (USD) | Notes |
|---|---|---|---|---|
| High-Tenacity Polyester | 2.80 | 1.27 | 2.00–4.80 | Industrial fabrics |
| High-Tenacity Nylon | 3.80 | 1.72 | 2.80–6.50 | Tire cord and technical textiles |
| Aramid Yarn | 25.00 | 11.34 | 15.00–50.00 | Heat-resistant applications |
| Carbon Fiber Yarn | 35.00 | 15.88 | 20.00–80.00 | Aerospace and composites |
| Glass Fiber Yarn | 3.50 | 1.59 | 2.50–6.00 | Technical reinforcement |
| Conductive Yarn | 20.00 | 9.07 | 12.00–40.00 | Smart textile applications |
| Metallic Yarn | 7.50 | 3.40 | 5.00–15.00 | Decorative fabrics |
| Reflective Yarn | 12.00 | 5.44 | 8.00–22.00 | Safety apparel |
| Recycled Cotton Yarn | 2.60 | 1.18 | 2.00–4.50 | Sustainable yarn option |
Popular Yarn Counts Used in Apparel
| Yarn Count | Typical Application |
|---|---|
| Ne 10–16 | Denim, towels, fleece |
| Ne 20 | Polo shirts, twill fabrics |
| Ne 24 | Basic knitwear |
| Ne 30 | T-shirts, jersey fabrics |
| Ne 32 | Premium T-shirts |
| Ne 40 | Poplin, shirting |
| Ne 50 | Premium woven fabrics |
| Ne 60 | Fine shirting |
| Ne 80+ | Luxury shirting and lightweight fabrics |
Why One Yarn Has Multiple Prices
| Factor | Effect |
|---|---|
| Fiber Quality | Better fiber grades command higher prices |
| Cotton Variety | Pima, Supima, and organic cotton cost more |
| Yarn Count | Finer counts generally increase spinning cost |
| Carded vs Combed | Combed yarn is more expensive |
| Compact Spinning | Adds premium due to higher quality |
| Certification | GOTS, OCS, BCI, GRS, and RCS increase costs |
| Raw Material Markets | Cotton, polyester, wool, and oil prices affect yarn values |
| MOQ | Smaller order quantities usually carry a premium |
| Cone Weight & Packaging | Export packing requirements can increase cost |
| Country of Origin | Spinning costs differ globally |
Buying Yarn Well
- Request quotations in USD/kg, which remains the global industry standard.
- Always confirm count, ply, twist, contamination level, and strength parameters before comparing suppliers.
- Ask whether prices are FOB, EXW, CIF, or DDP.
- Verify certification requirements such as GOTS, OCS, BCI, GRS, or RCS before costing.
- Compare multiple spinning mills, as yarn price differences of 5–15% are common.
- Monitor cotton and polyester raw material markets, as yarn prices can change rapidly.
- Secure shade and lot consistency when purchasing dyed yarns.
Understanding the Range
| Factor | Typical Impact |
|---|---|
| Cotton Market Movement | ±5–25% |
| Polyester Feedstock Cost | ±5–20% |
| Count Change | +10–60% |
| Combed vs Carded | +10–35% |
| Compact vs Ring | +10–25% |
| Organic Certification | +15–40% |
| Recycled Certification | +10–30% |
| Small MOQ Orders | +5–20% |
| Premium Export Mills | +10–35% |
Prices are typical global wholesale yarn benchmarks as of July 2026 and are intended for sourcing, budgeting, fabric planning, and apparel costing. Actual quotations vary by fiber quality, yarn count, spinning technology, certification requirements, order volume, country of origin, and raw-material market conditions.