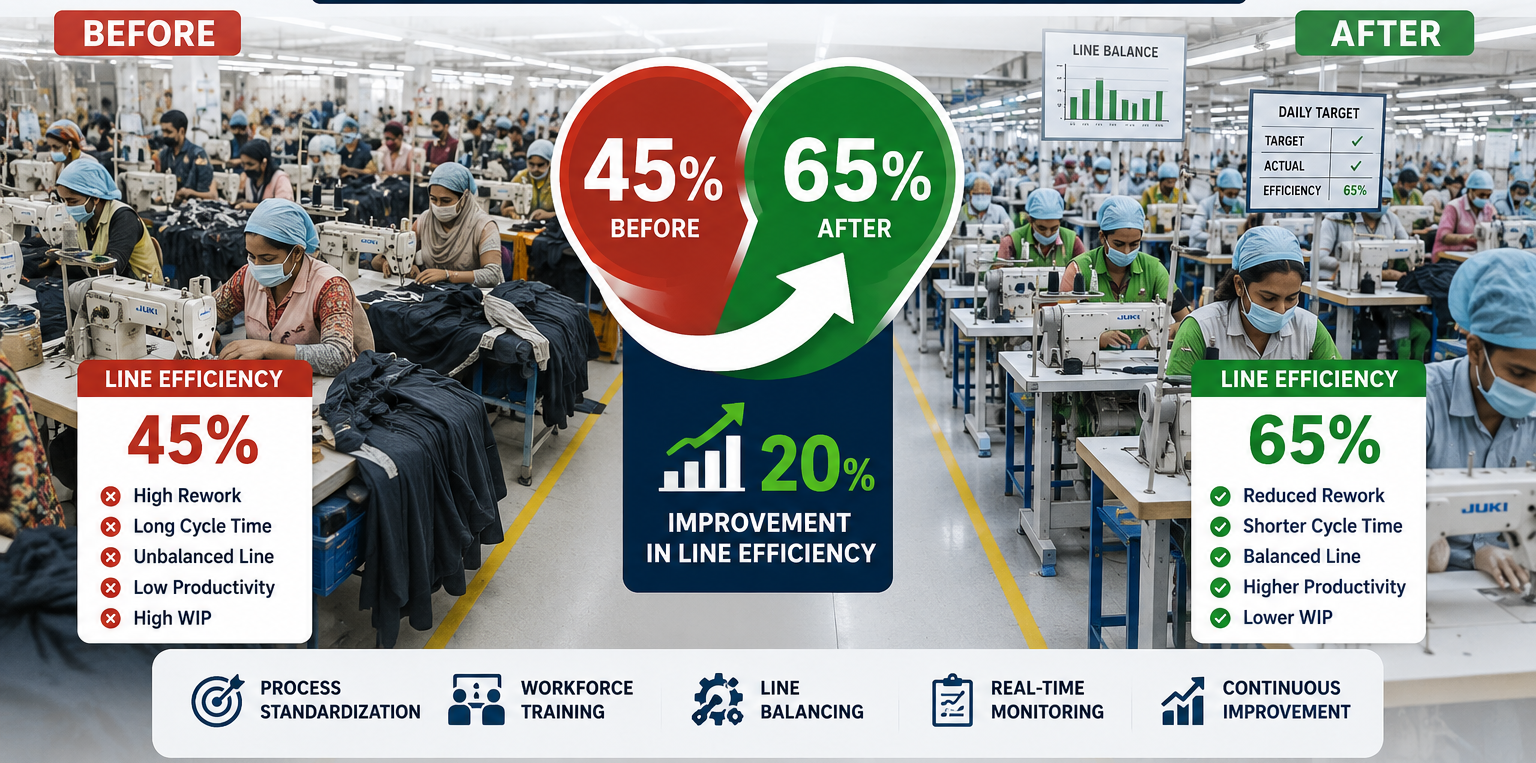
Line efficiency is one of the easiest ways to get a quick picture of what is happening inside a garment factory.
When efficiency is low, the problem is usually not limited to one thing. A sewing line may have enough operators but still produce less than expected because of bottlenecks, poor line balancing, machine breakdowns, quality problems or simply too much time spent waiting for the next operation.
Factory A was facing exactly this situation.
For several years, its sewing lines were running at around 45% efficiency. The factory had regular orders, but meeting shipment targets often meant relying on overtime. Even with the additional hours, production was not as consistent as management wanted.
Instead of adding more workers, the factory decided to look at the production system itself.
Over a twelve-month improvement program, the Industrial Engineering and production teams concentrated on three broad areas: people, process and productivity.
The result was a significant improvement. Line efficiency increased from 45% to 65%, while the factory achieved the improvement without adding extra manpower.
This case study explains what was happening at the factory, where the losses were coming from and what actions were taken to improve the situation.
What Does Line Efficiency Actually Mean?
Line efficiency measures how effectively the available labor time is converted into standard production output.
The basic formula is:
Line Efficiency (%) = Earned Minutes ÷ Available Minutes × 100
For example:
| Metric | Value |
|---|---|
| Available Minutes | 20,000 |
| Earned Minutes | 9,000 |
| Efficiency | 45% |
An efficiency of 45% means that only 45% of the available labor minutes were converted into earned production minutes.
The remaining capacity was effectively being lost through waiting, bottlenecks, quality problems, machine downtime, unnecessary movement and other interruptions.
A Simple Factory Example
Consider Line 4 at Factory A.
The line had 40 operators working an eight-hour shift.
That gives:
40 × 480 minutes = 19,200 available minutes
If the line earned only 8,640 standard minutes during that shift:
8,640 ÷ 19,200 × 100 = 45%
Suppose the line was producing a basic polo shirt with an SMV of 12 minutes. At 45% efficiency, the line might produce around 720 pieces against a target of 1,600 pieces.
So the problem was not simply that operators were working slowly. A large amount of available production time was being lost somewhere in the system.
Factory A Before the Improvement Program
Factory A produced both knit and woven garments for international buyers. Order demand was reasonably stable, so management could not blame the low efficiency on a lack of business.
The bigger problem was converting available capacity into consistent output.
Several issues were happening at the same time:
Operator productivity was low
Rework was high
Sewing lines were poorly balanced
Operators spent considerable time waiting
Bottlenecks appeared frequently
Absenteeism affected line capacity
WIP accumulated between operations
Supervision was not strong enough
Machine downtime interrupted production
Overtime became the easiest way to try to recover lost production.
But overtime was treating the symptom rather than the cause.
The factory needed to understand why the lines were losing so much time during normal working hours.
Initial Performance
| KPI | Before Improvement |
|---|---|
| Line Efficiency | 45% |
| DHU | 18% |
| Rework Rate | 12% |
| Operator Utilization | 55% |
| Overtime Hours | High |
| Shipment Performance | Inconsistent |
Management therefore decided that simply asking operators to increase their speed would not solve the problem.
The production system itself needed attention.
Finding the Root Causes
An Industrial Engineering team carried out an operation-by-operation review of the sewing lines.
They looked at SMVs, operator capacity, machine availability, WIP movement, quality losses and production output.
Five major problem areas became clear.
1. The Sewing Lines Were Not Properly Balanced
One of the most obvious problems was the difference in workload between operations.
Some operators had more work than they could handle, while others were waiting for bundles.
A simplified example looked like this:
| Operation | SMV | Status |
|---|---|---|
| Sleeve Join | 1.2 | Waiting |
| Collar Attach | 2.8 | Bottleneck |
| Hemming | 0.8 | Frequently idle |
The problem was not necessarily the individual operator.
The workload distribution was the problem.
When one operation cannot keep up with the required production rate, the shortage moves through the entire line. Operators downstream eventually have nothing to work on, while WIP builds up before the bottleneck.
Example from Line 7
Collar Attach had an SMV of 2.8 minutes and was identified as the main bottleneck.
The operator assigned to the operation was averaging around 2.4 pieces per minute of capacity against a line requirement of approximately 3.2 pieces per minute.
The result was a continuous shortage of output from that operation.
At the same time, Hemming had a much lower SMV of 0.8 minutes. The operator could process the available bundles quickly and then had to wait for more work.
In other words, the line's output was being restricted by the slower operation while capacity was sitting unused elsewhere.
This is a typical line-balancing problem.
2. Rework Was Taking Away Production Capacity
Quality problems were another major source of lost time.
Common defects included:
Open seams
Skip stitches
Measurement problems
Incorrect labels
Panel mismatches
The important point about rework is that the factory effectively pays for the same operation twice.
An operator first spends time making the garment. Someone then has to spend additional time correcting it.
Example
One batch of 500 knit T-shirts was inspected at end line.
Ninety pieces were found with skipped stitches on the side seam.
That represented an 18% DHU for the batch.
If each defective garment required approximately three minutes to repair:
90 × 3 = 270 minutes
That is 4.5 hours of additional labor spent correcting work that should have been right the first time.
This was one of the reasons the factory's efficiency remained low even when operators appeared busy throughout the shift.
3. Operator Skill Levels Were Uneven
Another issue was the lack of structured skill development.
Some operators had learned their operations informally. New employees were often placed on production lines before receiving enough practical training.
This created problems with:
Machine handling
Method of operation
Work handling
Sewing technique
Quality awareness
Working speed
Example: Zipper Attach
One new operator was assigned to Zipper Attach, an operation with an SMV of 1.5 minutes.
During her first two weeks, she was averaging approximately 2.6 minutes per piece.
She had not received structured training on the correct guide-and-feed method for the operation and was learning largely through trial and error.
Apart from the lost production, this also contributed to quality problems.
The factory therefore realized that operator training needed to become part of the production system rather than something provided only when problems appeared.
4. WIP Was Too High
Large amounts of work-in-progress were accumulating between operations.
At first glance, high WIP can make a factory look busy.
In reality, excessive WIP can hide problems.
A bottleneck may remain unnoticed because there are thousands of pieces waiting in front of it. Quality issues can also travel much further down the production line before being detected.
Example
One line had more than 1,200 pieces of WIP between cutting and sewing input.
That represented almost two days of buffer stock.
Later, a labeling problem was identified in the batch. By that time, approximately 400 pieces had already moved downstream.
The large WIP buffer had effectively hidden the problem.
The factory needed a system that would make production problems visible earlier.
5. Machine Downtime Was Another Hidden Loss
Machine problems were also contributing to the low efficiency.
Maintenance records showed repeated issues involving:
Needle breakage
Thread tension
Motors
Oil leakage
Mechanical wear
Example
An overlock machine on Line 2 experienced three breakdowns in one week because of a worn motor bearing.
Each breakdown resulted in approximately 20–30 minutes of waiting for maintenance support.
Over a month, that single machine accounted for an estimated six hours of lost production time.
The lesson was straightforward: a machine problem does not affect only the machine. It can also stop the operator, disrupt the flow of the line and reduce the output of downstream operations.
The Improvement Program
After identifying the major causes, management set a clear target:
Increase line efficiency from 45% to 65%.
The program was divided into six major improvement areas.
Step 1: Improve Line Balancing
The IE team reviewed each operation and compared the workload with the actual capacity of the operators.
The main actions included:
Redistributing workloads
Reducing bottlenecks
Moving operators between operations
Validating SMVs
Matching operator capacity with required production
Reviewing machine allocation
The results were noticeable:
| KPI | Before | After |
|---|---|---|
| Balance Efficiency | 68% | 87% |
| Bottlenecks | Frequent | Minimal |
| Waiting Time | High | Low |
Line balancing produced the largest individual contribution to the overall efficiency improvement.
Estimated efficiency impact: +8 percentage points
What Happened on Line 7?
The Collar Attach operation was divided into two smaller work elements.
Instead of one operator handling the complete 2.8-minute operation, the work was redistributed between two operators.
A second machine was also moved from an underutilized area.
Within about a week, output at the operation increased from approximately 720 pieces to 1,140 pieces per shift.
At the same time, waiting time at Hemming dropped significantly.
This is a good example of why adding manpower is not always the answer. Sometimes the available manpower simply needs to be distributed differently.
Step 2: Develop Operator Skills
The factory introduced a more structured training system.
Training covered:
Sewing methods
Machine operation
Standard operating procedures
Quality requirements
Productivity expectations
Correct work handling
New operators received training before being fully assigned to production. Existing operators also received refresher training where necessary.
The improvement in the Zipper Attach operation was a good example.
The operator who had initially required around 2.6 minutes per piece received three days of structured training covering machine setup, guide alignment and hand movement.
She then continued with supervised practice.
By the fourth week, her cycle time had reduced to around 1.6 minutes, much closer to the 1.5-minute standard.
Her defect rate also dropped from approximately 12% to below 3%.
Estimated efficiency impact: +5 percentage points
Step 3: Reduce Rework
The factory did not want to simply repair defects faster.
The focus shifted toward finding out why the defects were occurring in the first place.
Quality and IE teams worked together using:
Inline inspection
Operator self-checking
Defect tracking
Root cause analysis
Daily quality discussions
The improvements were significant:
| Defect Type | Reduction |
|---|---|
| Open Seam | 65% |
| Skip Stitch | 60% |
| Measurement Issue | 55% |
| Label Error | 70% |
Overall:
DHU fell from 18% to 7%
Rework rate fell from 12% to 4%
Estimated efficiency impact: +4 percentage points
Example: Open-Seam Problem
The quality team traced repeated open-seam defects back to a particular operation.
Instead of waiting until end-line inspection, operators were given a simple self-check method.
Every tenth piece was checked against a defect reference card kept at the workstation.
If a problem started appearing repeatedly, the operator and supervisor could respond immediately.
Over the following weeks, open-seam defects dropped from around 90 pieces per 500-piece batch to approximately 30.
Step 4: Improve the Workstation Layout
Not every productivity loss comes from major bottlenecks.
Sometimes operators simply spend hundreds of small movements during a shift doing things that could be eliminated.
The IE team reviewed workstation layouts and looked at:
Material position
Bundle handling
Operator movement
Tool location
Ergonomics
Material flow
Example
On one line, bundles were stored behind the operators.
This meant the operator had to repeatedly turn and reach backward to collect material.
A side-mounted bundle rack was installed at approximately waist height.
The movement became much shorter.
The change saved only a few seconds at a time, but across hundreds of pieces and multiple operators, those seconds added up.
Estimated efficiency impact: +1.5 percentage points
Step 5: Introduce WIP Control
The factory introduced basic WIP limits between operations.
The idea was simple:
Do not allow large piles of work to hide production problems.
The new system included:
WIP limits
Hourly monitoring
Visual boards
Line tracking
Defined escalation points
For example, a maximum WIP limit of 200 pieces was established between selected operations.
The system used visual indicators:
Green: below 150 pieces
Yellow: 150–200 pieces
Red: above 200 pieces
When WIP reached the warning level, the supervisor investigated the reason.
This meant that a problem could be addressed before it became a 1,000-piece backlog.
Estimated efficiency impact: +1 percentage point
Step 6: Strengthen Production Monitoring
The factory also changed the way supervisors monitored production.
Instead of waiting until the end of the shift to find out whether a line had achieved its target, supervisors began checking performance hourly.
The main indicators included:
Hourly output
Target versus actual
Efficiency
Attendance
Defects
Bottlenecks
Machine problems
Example
Suppose a line had a target of 110 pieces for an hour but produced only 85.
The supervisor could immediately go to the line and find out why.
If the problem was a machine issue, manpower shortage or material shortage, corrective action could be taken during the same hour.
Previously, the same problem might only have become obvious at the end of the shift.
Estimated efficiency impact: +0.5 percentage point
Where Did the 20 Percentage Points Come From?
The estimated contribution of each improvement area was summarized as follows:
| Improvement Area | Efficiency Gain | Share of Total Gain |
|---|---|---|
| Line Balancing | +8.0 points | 40% |
| Operator Skill Development | +5.0 points | 25% |
| Rework Reduction | +4.0 points | 20% |
| Workstation Layout | +1.5 points | 7.5% |
| WIP Control | +1.0 point | 5% |
| Production Monitoring | +0.5 point | 2.5% |
| Total | +20 points | 100% |
So the overall movement was:
45% → 65%
These percentages should be viewed as illustrative contributions rather than perfectly isolated measurements. In an actual factory, the improvement activities interact with one another.
For example, better training can reduce defects, while better line balancing can reduce WIP. Production monitoring can then help sustain both improvements.
The Role of Industrial Engineering
The IE team was central to the improvement program.
Their work included:
Time studies
SMV validation
Capacity analysis
Line balancing
Method study
Layout improvement
Productivity tracking
Bottleneck analysis
Perhaps the most important change was the move away from assumptions.
Instead of saying an operator was "slow," the team looked at the operation, SMV, actual cycle time and available capacity.
Instead of saying a line was "busy," they looked at WIP, output and bottlenecks.
That difference matters.
Production improvement becomes much easier when problems are measured rather than guessed.
Operator Involvement Was Also Important
The improvement program was not driven entirely by engineers and managers.
Operators were encouraged to raise problems and suggest improvements.
This turned out to be useful because operators often see small problems that are easy to miss during a formal IE study.
A Simple Example
One experienced operator pointed out that the position of her thread cone forced her to reach across her body repeatedly during production.
The IE team tested a different position.
The new arrangement reduced the movement by a few seconds per cycle.
It was a small change, but the same adjustment could then be applied to other operators performing the same operation.
This illustrates an important principle:
The person doing the work every day can sometimes identify the easiest improvement.
Results After the Improvement Program
After the improvement activities were implemented and monitored, the factory showed significant changes.
| KPI | Before | After |
|---|---|---|
| Line Efficiency | 45% | 65% |
| Operator Efficiency | 50% | 70% |
| DHU | 18% | 7% |
| Rework Rate | 12% | 4% |
| WIP Level | High | Controlled |
| Overtime Hours | High | Reduced |
The most important point was that the factory achieved the improvement without increasing headcount.
The additional output came from better utilization of the capacity that was already available.
Financial Impact
Improving efficiency is not only about achieving a better production KPI.
If the improvement is real, it should eventually appear in the factory's financial performance as well.
The main benefits identified at Factory A were:
More output from the existing workforce
Lower manufacturing cost per garment
Reduced overtime
Lower rework cost
Better utilization of production capacity
More reliable shipment performance
Improved customer satisfaction
Estimated Annual Benefit
| Area | Annual Savings ($) |
|---|---|
| Reduced Overtime | 120,000 |
| Lower Rework Cost | 180,000 |
| Higher Productivity | 350,000 |
| Improved Capacity Utilization | 200,000 |
| Total Benefit | 850,000 |
The figures show why productivity improvement can have a much larger financial impact than simply looking at the efficiency percentage.
A 20-point improvement in line efficiency can affect labor utilization, overtime, capacity and quality at the same time.
What Factory A Learned
The experience produced several lessons that are useful for other garment factories as well.
1. Efficiency and quality are connected
A line producing more pieces is not necessarily more productive if a large percentage of those pieces require rework.
2. Line balancing should come early
If one operation is significantly slower than the others, the entire line can suffer.
3. Training is a productivity investment
A skilled operator can produce better quality at a higher rate than an operator who is still learning the correct method while working on the production line.
4. Rework consumes capacity twice
The factory loses time when the original garment is produced incorrectly and loses more time when somebody has to repair it.
5. Too much WIP can hide problems
Large buffers may make a production floor look busy, but they can also delay the discovery of bottlenecks and quality issues.
6. Small improvements can add up
Changing the location of a bundle rack may seem insignificant. Repeating that improvement across hundreds of operators and thousands of pieces can produce a meaningful result.
7. Measure before making decisions
Actual production data is more useful than assumptions about where the problem is.
8. Operators should be part of the improvement process
The production team often has practical knowledge that cannot be captured completely through reports or time studies.
Conclusion
Factory A's improvement from 45% to 65% line efficiency did not come from simply asking workers to produce faster.
The factory improved because it started addressing the causes of lost production time.
Lines were balanced more carefully. Operators received structured training. Quality problems were attacked at their source. Workstations were redesigned. WIP was controlled, and supervisors began responding to production problems while they were still happening.
The result was higher output from essentially the same workforce, combined with lower rework and overtime.
The broader lesson is important for garment manufacturing:
Improving efficiency is not about making people work harder. It is about removing the reasons they cannot work effectively.
When the right workload is given to the right operation, operators have the right skills, machines are available, defects are controlled and production problems are visible early, the same workforce can often achieve considerably more.
That is what happened at Factory A—and it is why moving from 45% to 65% was ultimately less about speed and more about building a better production system.