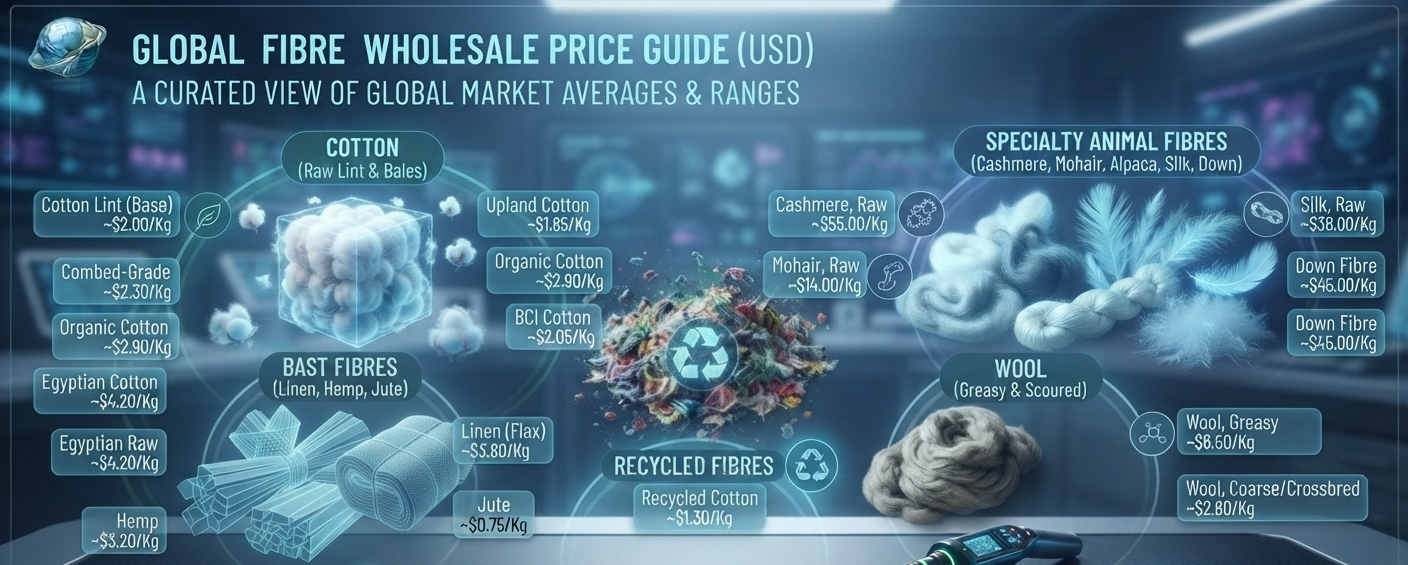
Updated July 2026 · Prices in USD · Figures below represent typical global wholesale and export-market raw fibre prices sourced from major producing/trading regions including the USA, China, India, Pakistan, Australia, Brazil, Central Asia, and Central/East Africa.
A reference for spinning mills, fibre traders, sourcing teams, merchandisers, and costing engineers: current global raw fibre price benchmarks (pre-spinning stage) presented in both USD per kilogram (kg) and USD per pound (lb), along with typical global price ranges.
Note: This guide covers raw/base fibre prices (lint, tow, top, greasy/clean, staple) — the input stage before spinning. It is the natural companion to a yarn price guide, since yarn = fibre + spinning cost + spinner's margin. Expect yarn prices to run roughly 25–70% above the equivalent raw fibre price, depending on count, process, and value addition.
Conversion used: 1 Kilogram = 2.2046 Pounds → Price per Pound = Price per Kg ÷ 2.2046
Natural Fibres
| Fibre Type | Avg. Price/Kg (USD) | Avg. Price/Lb (USD) | Global Price Range/Kg (USD) | Top Seller Countries | Notes |
|---|---|---|---|---|---|
| Cotton Lint (Base/Index, e.g. Cotlook A) | 2.00 | 0.91 | 1.70–2.40 | USA, Brazil, India, Australia | Global benchmark grade, raw ginned lint |
| Cotton, Upland/Standard | 1.85 | 0.84 | 1.60–2.20 | USA, India, Pakistan, Brazil | Machine-picked, medium staple |
| Cotton, Combed-Grade Lint | 2.30 | 1.04 | 1.90–2.80 | India, USA, China | Longer staple, lower trash content |
| Pima / Supima Cotton | 3.60 | 1.63 | 2.80–4.80 | USA, Peru | Extra-long staple (ELS), premium |
| Egyptian (Giza) Cotton | 4.20 | 1.90 | 3.20–6.00 | Egypt | ELS, premium fine-spinning grade |
| Organic Cotton Lint | 2.90 | 1.32 | 2.30–3.80 | India, Turkey, Tanzania | Certified (GOTS/OCS) |
| BCI / Better Cotton | 2.05 | 0.93 | 1.75–2.50 | India, Pakistan, Brazil, China | Mass-balance sustainable cotton |
| Recycled Cotton Fibre | 1.30 | 0.59 | 0.90–1.90 | India, Pakistan, Bangladesh | Mechanically recycled, shorter staple |
| Linen (Flax) Fibre | 3.80 | 1.72 | 2.80–6.00 | France, Belgium, China | Long-line flax, scutched |
| Hemp Fibre | 3.20 | 1.45 | 2.20–5.00 | China, France, Central Asia | Decorticated bast fibre |
| Jute Fibre | 0.75 | 0.34 | 0.55–1.10 | Bangladesh, India | Raw baled jute |
| Wool, Greasy (Merino, 19–21 micron) | 6.50 | 2.95 | 4.50–9.50 | Australia, New Zealand, South Africa | Raw, unscoured, price varies sharply with micron |
| Wool, Scoured/Clean (Merino) | 11.50 | 5.22 | 8.00–16.00 | Australia, New Zealand, China (processing) | Clean basis, after scouring losses |
| Wool, Coarse/Crossbred, Greasy | 2.80 | 1.27 | 1.80–4.00 | New Zealand, UK, Argentina | Carpet-grade wool |
| Cashmere, Raw/Dehaired | 55.00 | 24.94 | 40.00–90.00 | China, Mongolia | Dehaired, ready-to-spin; highly volatile market |
| Mohair, Raw | 14.00 | 6.35 | 9.00–22.00 | South Africa, Lesotho, Turkey | Adult/kid grades vary widely |
| Alpaca Fibre, Raw | 12.00 | 5.44 | 8.00–20.00 | Peru, Bolivia | Huacaya, sorted |
| Silk, Raw (Mulberry, Grade A) | 38.00 | 17.24 | 28.00–55.00 | China, India, Uzbekistan | Reeled raw silk, price tracks China/India markets |
| Silk, Tussar/Wild | 18.00 | 8.16 | 12.00–28.00 | India | Non-mulberry wild silk |
| Down Fibre (Goose, 90/10) | 45.00 | 20.41 | 30.00–70.00 | China, Poland, Hungary | Fill power grade dependent |
Man-Made / Synthetic Fibres
| Fibre Type | Avg. Price/Kg (USD) | Avg. Price/Lb (USD) | Global Price Range/Kg (USD) | Top Seller Countries | Notes |
|---|---|---|---|---|---|
| Polyester Staple Fibre (PSF), China FOB | 1.00 | 0.45 | 0.85–1.20 | China, India | 1.4D×38mm, virgin, most-traded benchmark |
| Polyester Staple Fibre, USA/Europe | 1.45 | 0.66 | 1.20–1.65 | USA, Germany, South Korea | Higher regional feedstock/energy cost |
| Polyester POY/FDY Chips or Feedstock Basis | 1.10 | 0.50 | 0.90–1.40 | China, India, South Korea | Filament-grade polymer chip |
| Recycled Polyester Staple (rPSF) | 1.15 | 0.52 | 0.90–1.60 | China, India, Taiwan | From PET bottle flake; premium to virgin at times |
| Viscose/Rayon Staple Fibre (VSF) | 1.40 | 0.63 | 1.10–1.80 | China, India, Indonesia | Wood-pulp based, China/India benchmark |
| Modal Fibre | 1.90 | 0.86 | 1.50–2.50 | Austria, China, Indonesia | Higher-wet-strength viscose variant |
| Lyocell (Tencel-type) Fibre | 2.30 | 1.04 | 1.80–3.20 | Austria, China | Closed-loop solvent process, premium |
| Acrylic Staple Fibre | 1.75 | 0.79 | 1.40–2.30 | China, India, Turkey | Sweater/knitwear feedstock |
| Nylon 6 Staple/Chip | 2.20 | 1.00 | 1.70–3.00 | China, South Korea, Taiwan | Carpet and technical fibre grade |
| Nylon 66 Chip | 2.60 | 1.18 | 2.00–3.50 | China, USA, Germany | Higher-performance polyamide |
| Polypropylene (PP) Staple Fibre | 1.10 | 0.50 | 0.85–1.50 | China, India, Saudi Arabia | Nonwovens, geotextiles |
| Spandex/Elastane Raw Fibre | 5.50 | 2.49 | 4.00–8.50 | China, South Korea, Taiwan | Bare filament basis |
Blended & Specialty Fibre Feedstocks
| Fibre Type | Avg. Price/Kg (USD) | Avg. Price/Lb (USD) | Global Price Range/Kg (USD) | Top Seller Countries | Notes |
|---|---|---|---|---|---|
| Bamboo Viscose Fibre | 1.80 | 0.82 | 1.40–2.40 | China | Regenerated cellulosic |
| Soy Protein Fibre | 3.00 | 1.36 | 2.20–4.50 | China | Niche regenerated fibre |
| Milk Protein Fibre | 5.50 | 2.49 | 4.00–8.00 | China | Niche regenerated fibre |
| PLA (Corn-Based) Fibre | 2.60 | 1.18 | 2.00–3.50 | USA, China, Thailand | Biodegradable synthetic |
Technical & High-Performance Fibres
| Fibre Type | Avg. Price/Kg (USD) | Avg. Price/Lb (USD) | Global Price Range/Kg (USD) | Top Seller Countries | Notes |
|---|---|---|---|---|---|
| High-Tenacity Polyester Fibre | 2.10 | 0.95 | 1.60–3.00 | China, South Korea, USA | Industrial fabrics, belting |
| High-Tenacity Nylon Fibre | 3.20 | 1.45 | 2.40–4.50 | China, USA, Japan | Tire cord, ropes |
| Aramid Fibre (Para/Meta) | 22.00 | 9.98 | 14.00–45.00 | USA, Japan, China | Heat/ballistic resistant |
| Carbon Fibre (Tow) | 22.00 | 9.98 | 12.00–60.00 | Japan, USA, China | Grade and modulus dependent |
| Glass Fibre (Roving/Chopped Strand) | 1.60 | 0.73 | 1.10–2.50 | China, USA, India | Reinforcement fibre |
| Basalt Fibre | 3.50 | 1.59 | 2.50–5.50 | Russia, China, Ukraine | Reinforcement fibre |
| PBO/UHMWPE Fibre | 40.00 | 18.14 | 25.00–90.00 | Japan, Netherlands, USA | Ultra-high-performance |
Why One Fibre Has Multiple Prices
| Factor | Effect |
|---|---|
| Staple Length / Micron | Longer/finer fibres command higher prices |
| Grade & Trash Content | Cleaner, less-contaminated fibre costs more |
| Certification | GOTS, OCS, BCI, GRS, RWS, RCS add premiums |
| Origin | Freight, labor, and processing costs vary by country |
| Feedstock Market | Crude oil (synthetics), pulp (cellulosics), livestock cycles (wool/silk) |
| Virgin vs. Recycled | Recycled fibre can trade at a discount or premium depending on demand |
| Processing Stage | Greasy vs. scoured wool, raw vs. dehaired cashmere shift price sharply |
| Seasonality | Harvest cycles (cotton, wool, silk) create seasonal price swings |
Buying Fibre Well
- Request quotations in USD/kg, the global industry standard for fibre trading.
- Always confirm staple length/micron, moisture regain, trash/contamination content, and grade before comparing offers.
- Ask whether prices are FOB, CIF, CFR, or DDP, and which port/basis is used.
- Verify certifications (GOTS, OCS, BCI, RWS, GRS, RCS) before costing sustainable claims.
- Track relevant futures/index benchmarks (e.g., Cotlook A Index for cotton, ICE cotton futures, ZCE polyester staple futures) as a directional guide.
- Monitor crude oil (synthetics) and raw cotton/wool/pulp markets, since fibre prices move faster than yarn prices.
- Compare multiple origins/suppliers — a 5–20% spread between comparable lots is common.
Understanding the Range
| Factor | Typical Impact |
|---|---|
| Cotton Market Movement (ICE/Cotlook) | ±5–25% |
| Crude Oil / Feedstock Swings (synthetics) | ±10–30% |
| Wool Micron Change (±1 micron) | ±5–15% |
| Cashmere Market Volatility | ±20–60% (thin, seasonal market) |
| Combed/ELS vs. Standard Grade | +20–80% |
| Organic/Certified Premium | +15–45% |
| Recycled vs. Virgin | −10% to +20% (varies by fibre and demand cycle) |
| Small-Lot / Sample Orders | +10–25% |
Prices are typical global wholesale fibre benchmarks as of July 2026, informed by industry indices (Cotlook A, ICE cotton futures, ZCE polyester staple futures, and regional fibre-market reporting) and are intended for sourcing, budgeting, and costing purposes. Actual quotations vary by grade, origin, certification, order volume, and daily market movement — always confirm live pricing with your supplier or a real-time price-reporting service before finalizing costs.